


190. FROM WORLD WAR Z, THE ZOMBIE MOVIE
"Most people don’t believe something can happen until it already has. It’s not stupidity or weakness; it’s just human nature."

First, here is a follow-up about Musk from some of our most sophisticated commentators. You likely know of Whitney Webb, who wrote A Nation Under Blackmail, and James Corbett of the Corbett Report. I listened to this thing at 2 x speed, and it was worth every minute. The conclusion is that the globalists are in control of many of the messages. They use players who present partly accurate information with the “limited hangout” techniques. From what I have recently written, you may understand that parts of our “medical freedom movement” have been infiltrated in this way. HERE is the link for the following. Thanks to Christian Elliot for sending me this.
The following is the start of the Diversion chapter at the end of Part 7 of Cassandra’s Memo:
We are facing zombies now—people who can’t see the overwhelming evidence before their eyes. I have lost a lot of dear friends to this, for I have given up listening to circular arguments and suffering never-ending debates with people who quote the media gaslighting. (Pass me a chainsaw.)
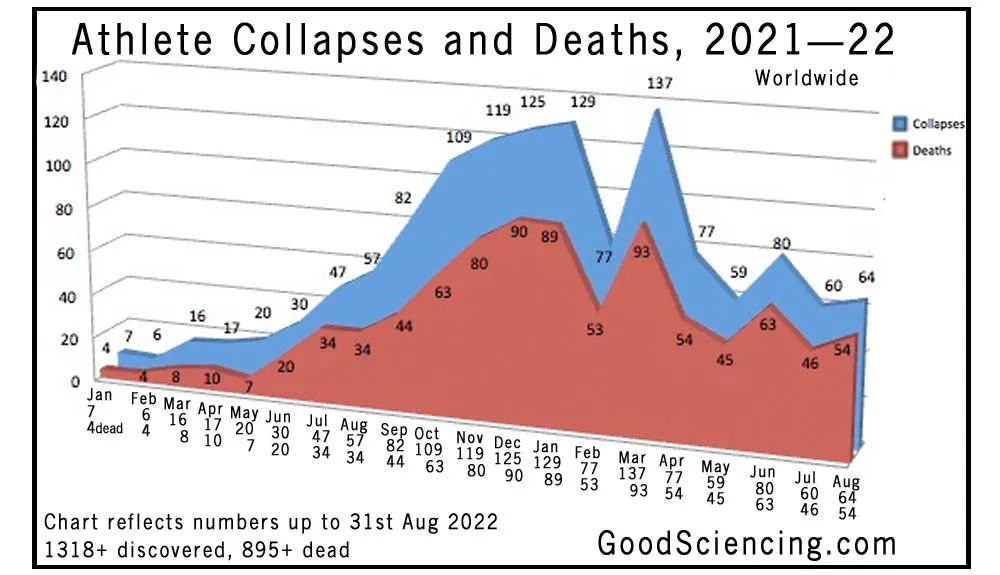
I barely watch sports, so I have trouble understanding how viewers feel about their heroes. I take that back—I once met Oleg Taktarov at a party. He was an early mixed martial arts star, and I felt like I was chatting with my long-lost brother. So the reality of the athletes collapsing and dying has become hard to deny if you are in love with Damar Hamlin.
The graph depicting the course of the vax rollout is obvious stuff for those of us who are awake. It does not even include the past six months.
This post has dramatic video graphic representation of the increase in deaths from every country in the world:

Here is what this looks like for Afghanistan, and there are over a hundred others in the short video.
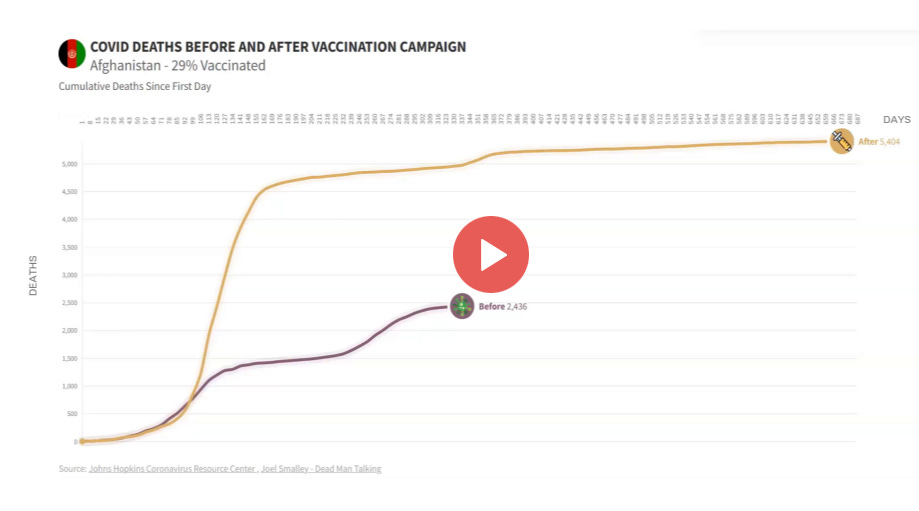
Sorry, I am a dummy. If my readers understand how these two curves relate, please put it in the comments.
Optimism: “The latest Rasmussen Reports national telephone and online survey finds that (49%) of American Adults believe it is likely that side effects of COVID-19 vaccines have caused a significant number of unexplained deaths, including 28% who think it’s Very Likely,” the firm reported.” This is a mainstream poll, so my estimate is 90 percent.
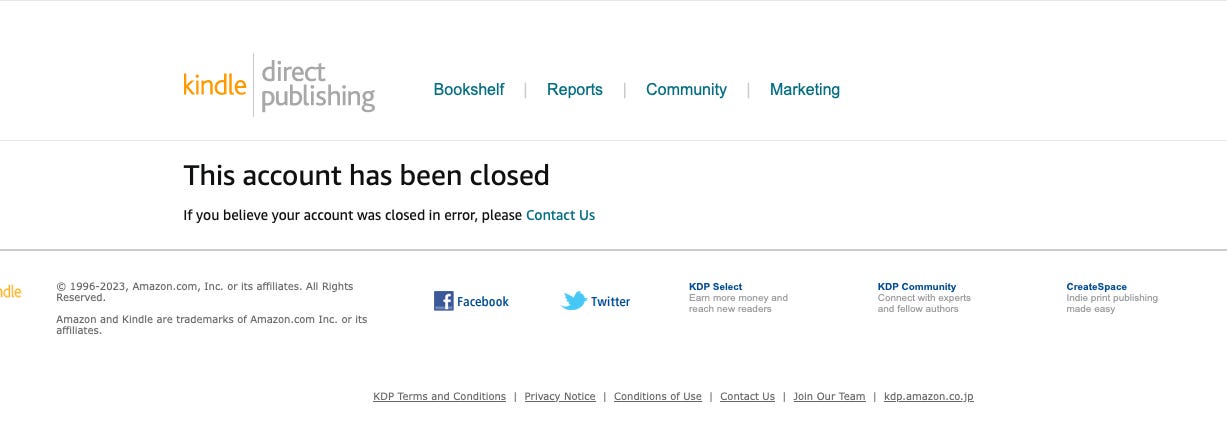
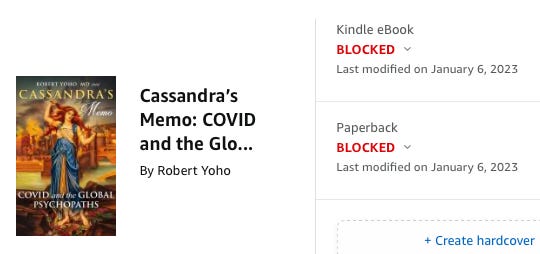
Quick update for Cassandra: Amazon banned my book, likely due to the transgender chapters. HERE is how you can download it right now. I will publish the paperback on other platforms. I am still soliciting your help to improve it, and since I am a self-publisher, I can easily correct anything you find. My other books are still up, but this freaked me out:

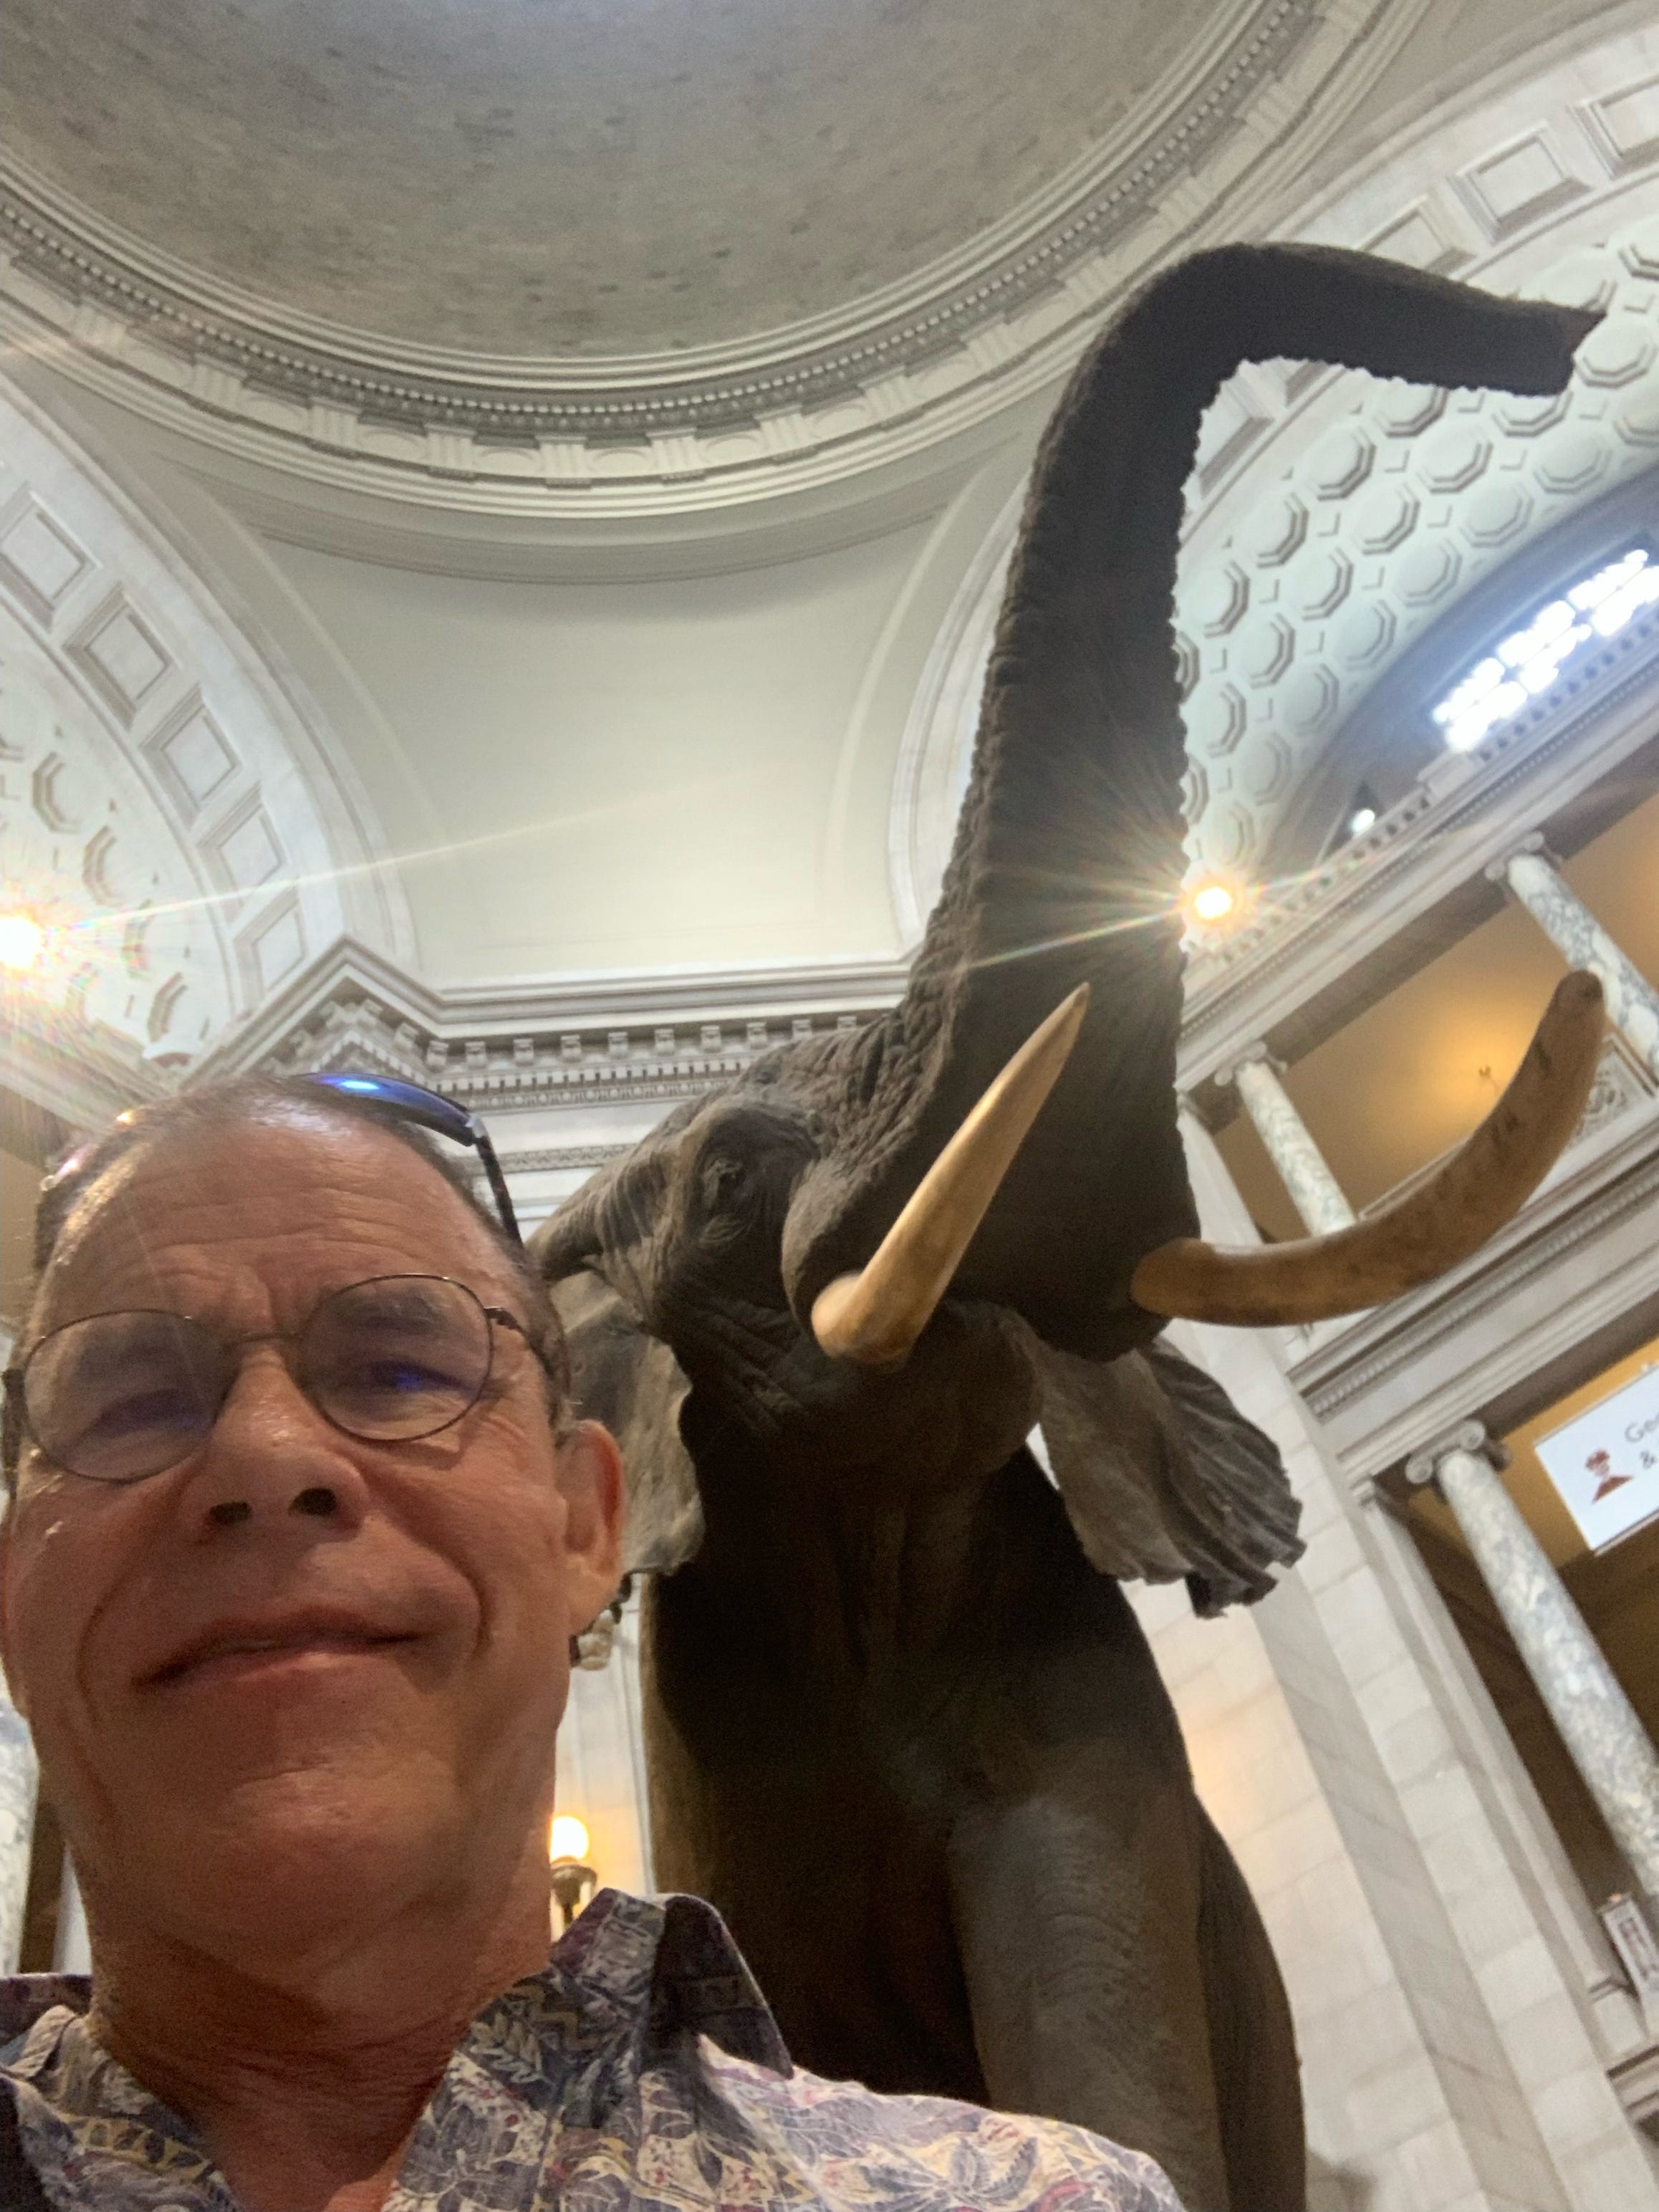
PS: I recently went to Washington, DC, and found a mess. Construction cranes were everywhere, so although the rest of the US was in a recession, they can still spend the the money they printed. Many tourists are still wearing masks.


The American Indian museum had fabulous architecture but was strangely sterile. The artifacts inside could have fit into a few closets. Disney seemed to have designed the exhibits.
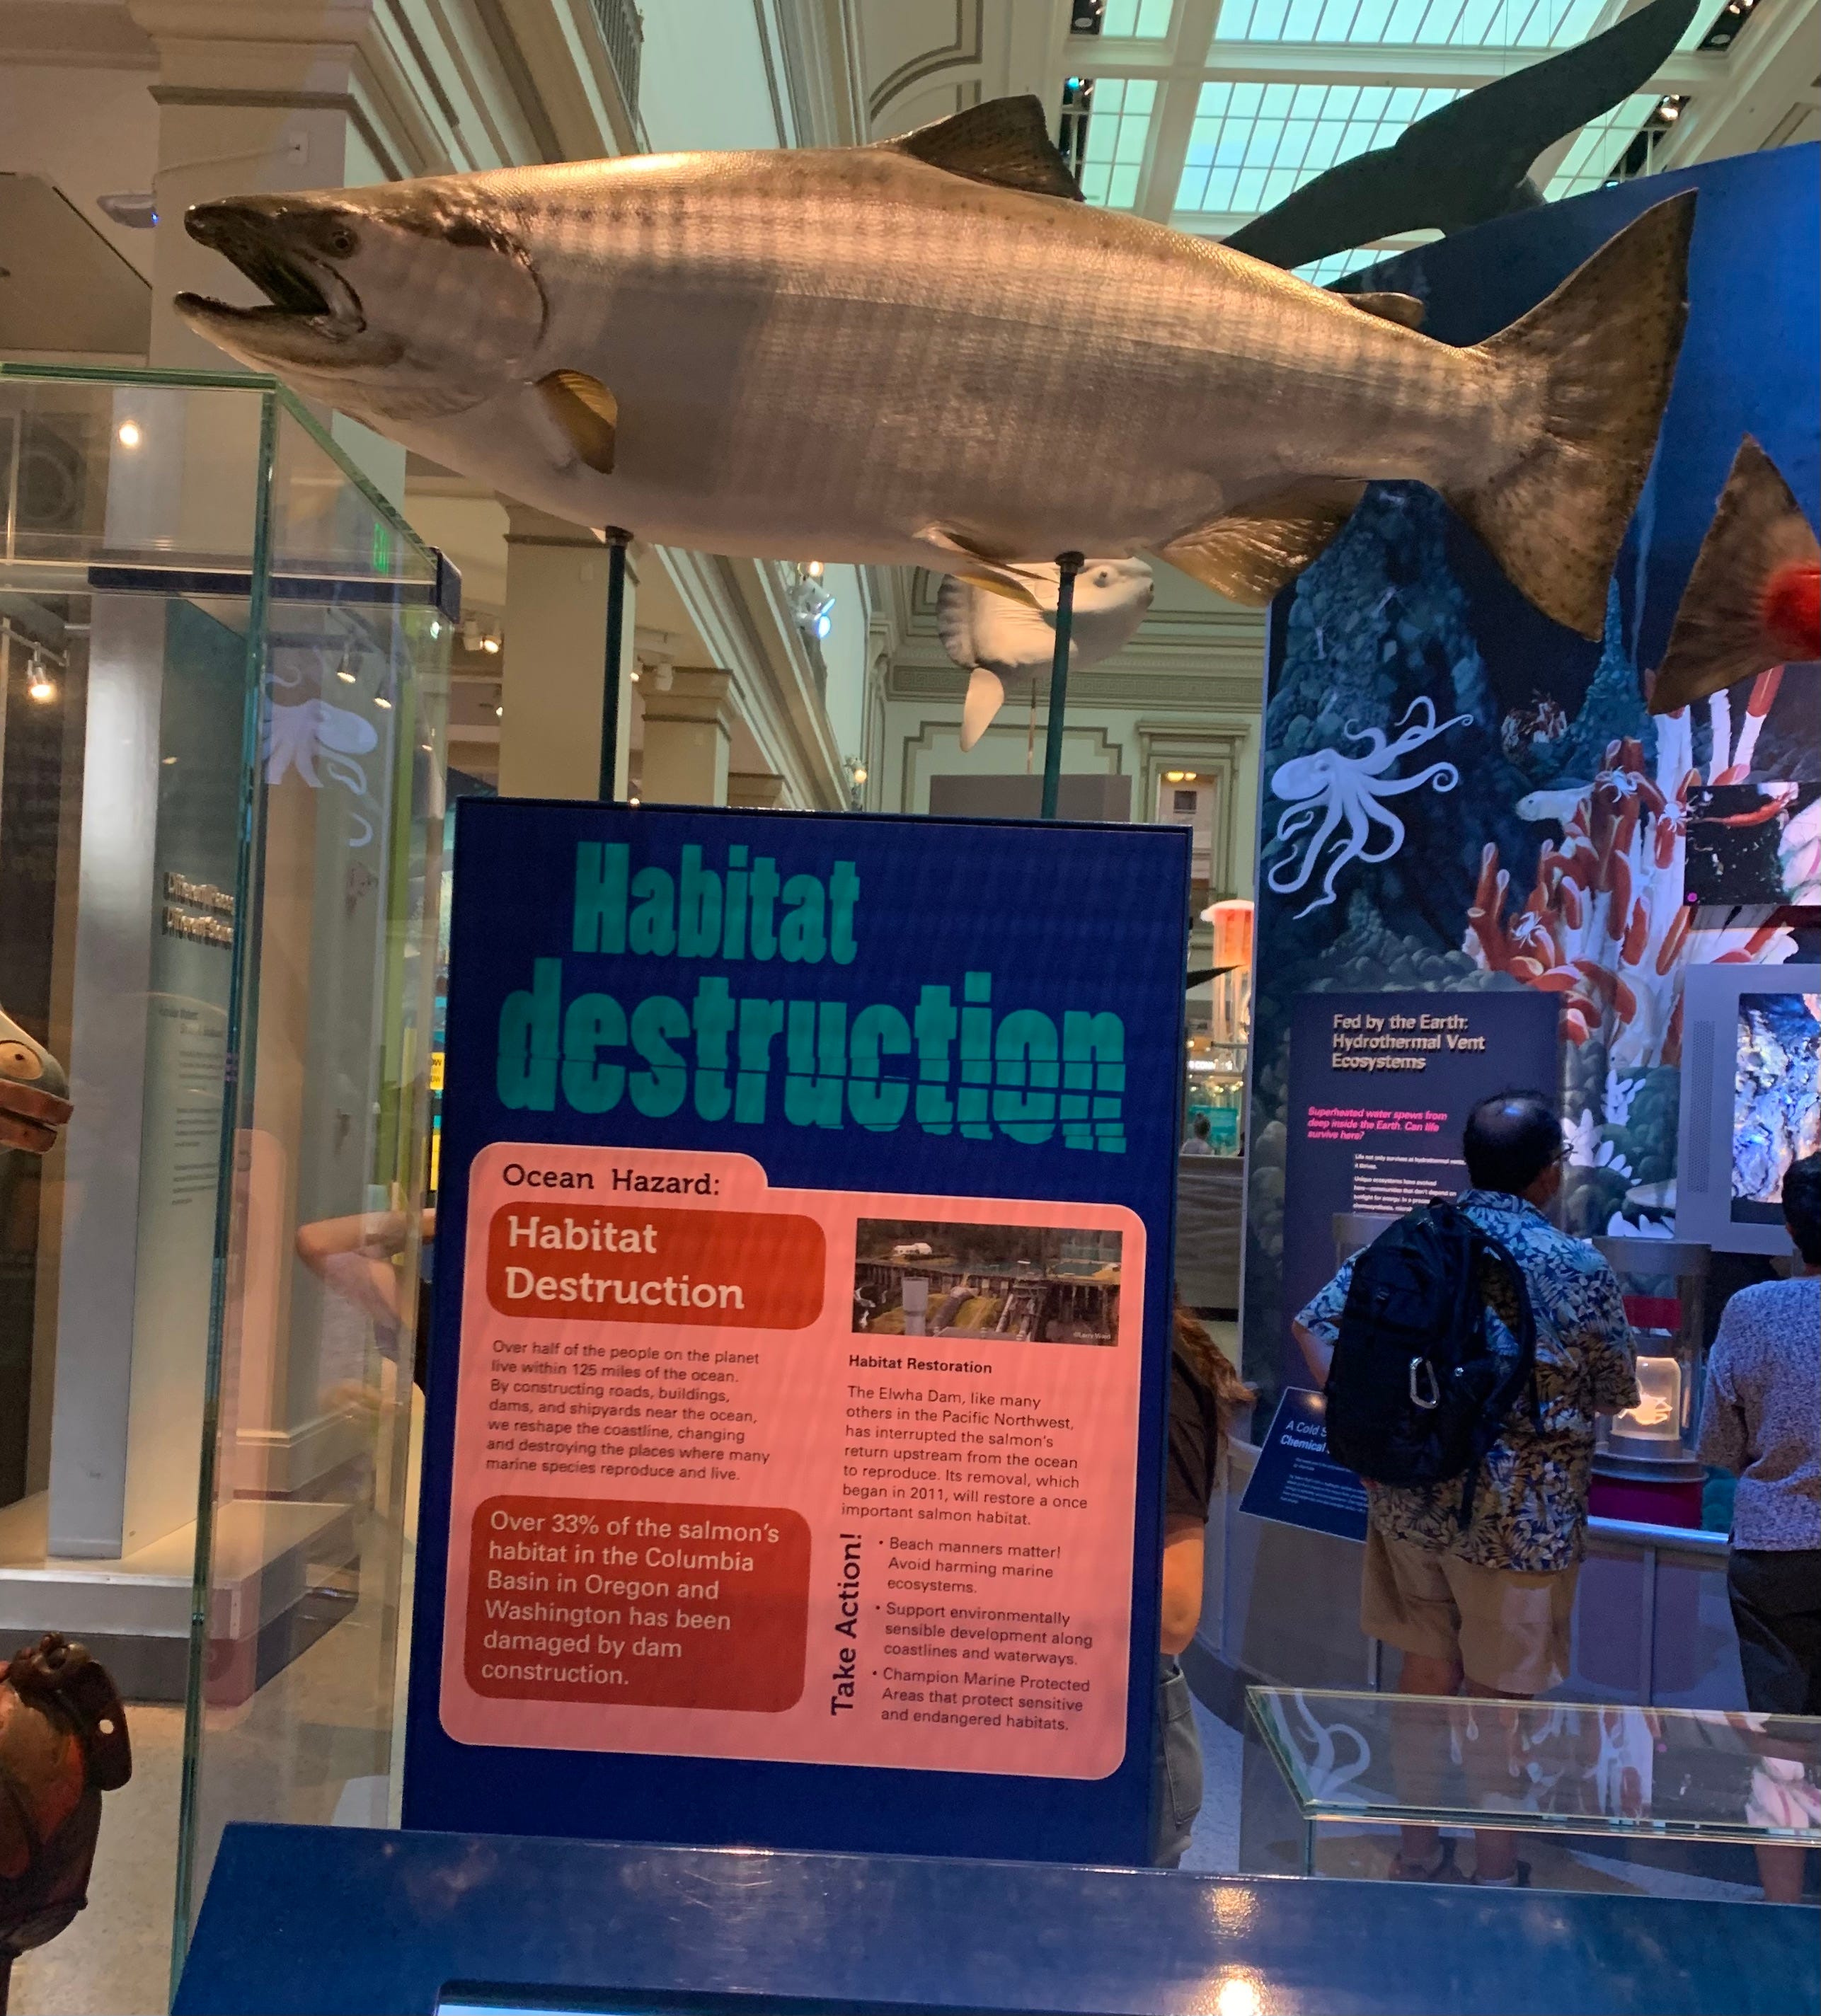
Gaslighting about ecological apocalypse was everywhere.

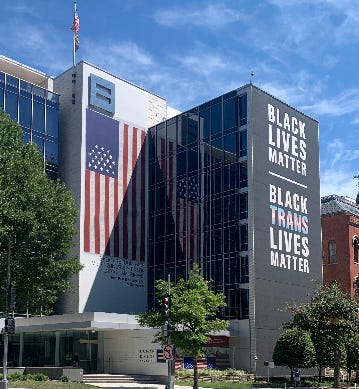
And I ran across the seal of the greatest financial criminals in history:

Related to the graphs... essentially comparing the timeline of deaths from the beginning of covid until the injection campaigns started and overlaying the timeline of number of deaths from the point the injections started. There are a couple of points... higher overall vaccination rates most often led to higher numbers of death after the campaigns started compared to the initial covid wave.
And, for the most part, deaths are higher after the campaign started.
Great Pictures and updates from DC! Thank you! Did you see Hiden, sorry Biden?
The reason for cassandra's rejection is just mindblowing, not even becasue of covid???
Btw. important question.
Peggy Hall from the The Healthy American analyzed ALL available materials in regard to
'Hamlin's fall' and her and others verdict is: premeditated deception. Apparently for many reasons, which make complete sense, to me...